Developing XSL can be sometimes cumbersome and tricky. Especially if it is
something you don’t do every day.
Luckily Visual Studio 2005 now provides the an XSL debugger.
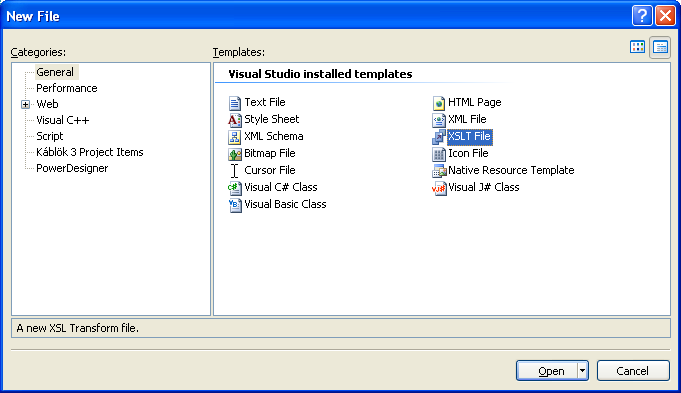
To debug an XSL open Visual Studio and open a Project go to the File Menu \
Select New File and Create a New XSLT file.
Write your XSL file.
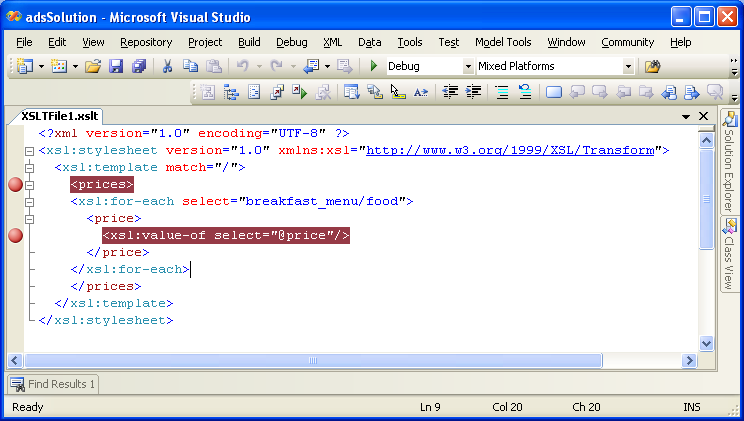
You can set breakpoints just by clicking on the left side of the editor just
like you do for VB.Net of C#.
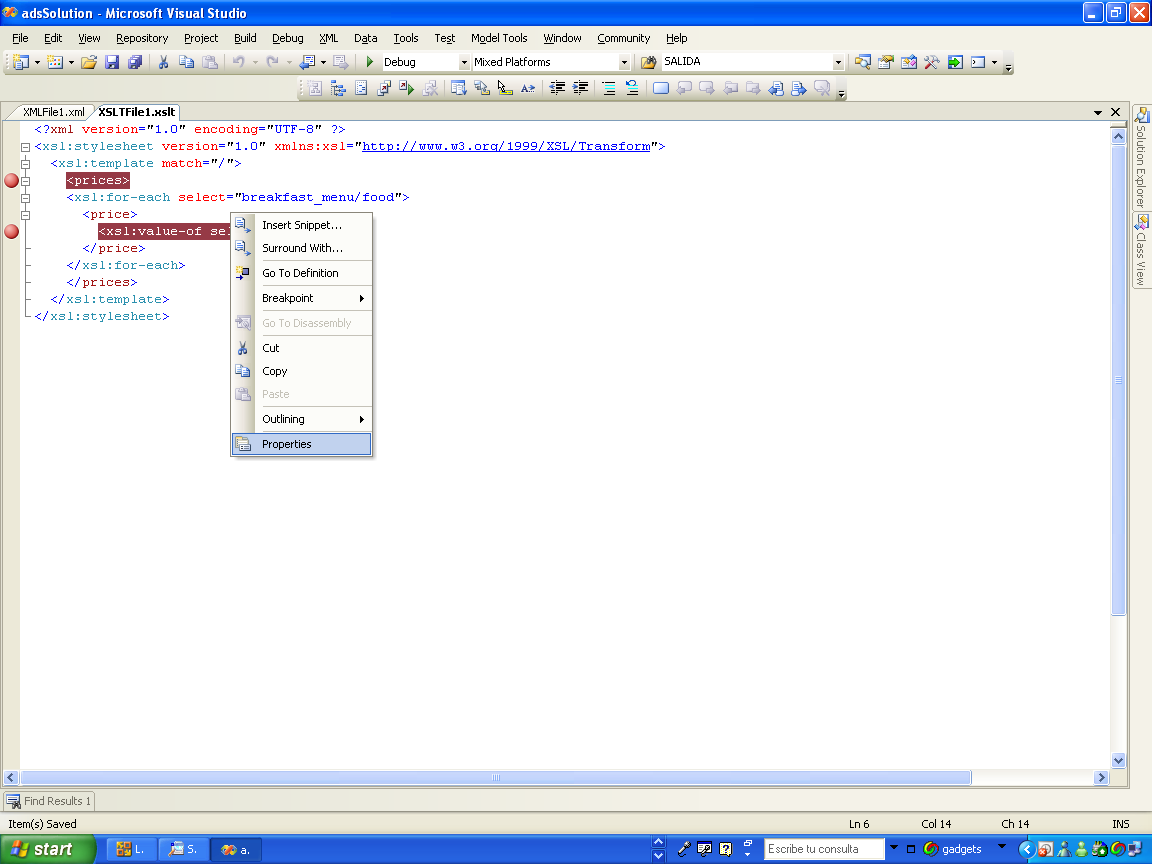
Now to test it right click on the editor and select properties:
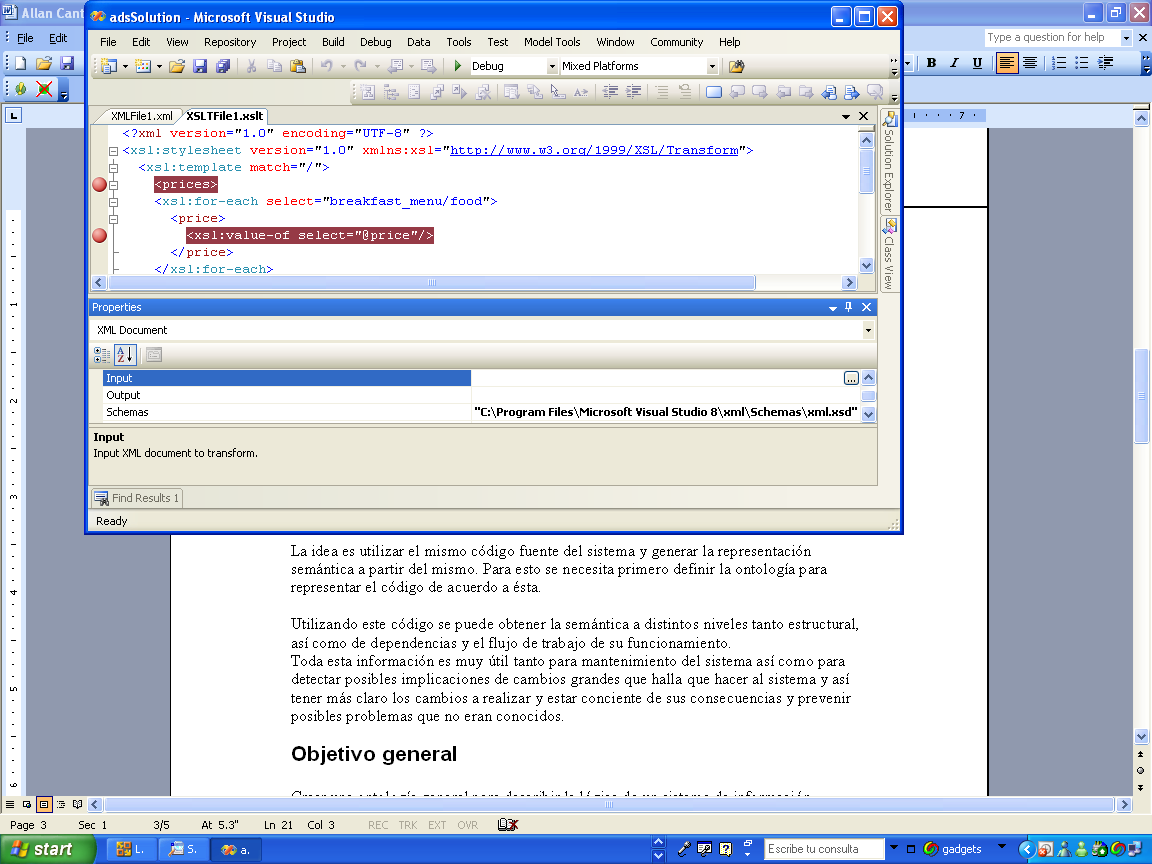
In the properties for the XSL type a name on the
The XML menu provides two options:
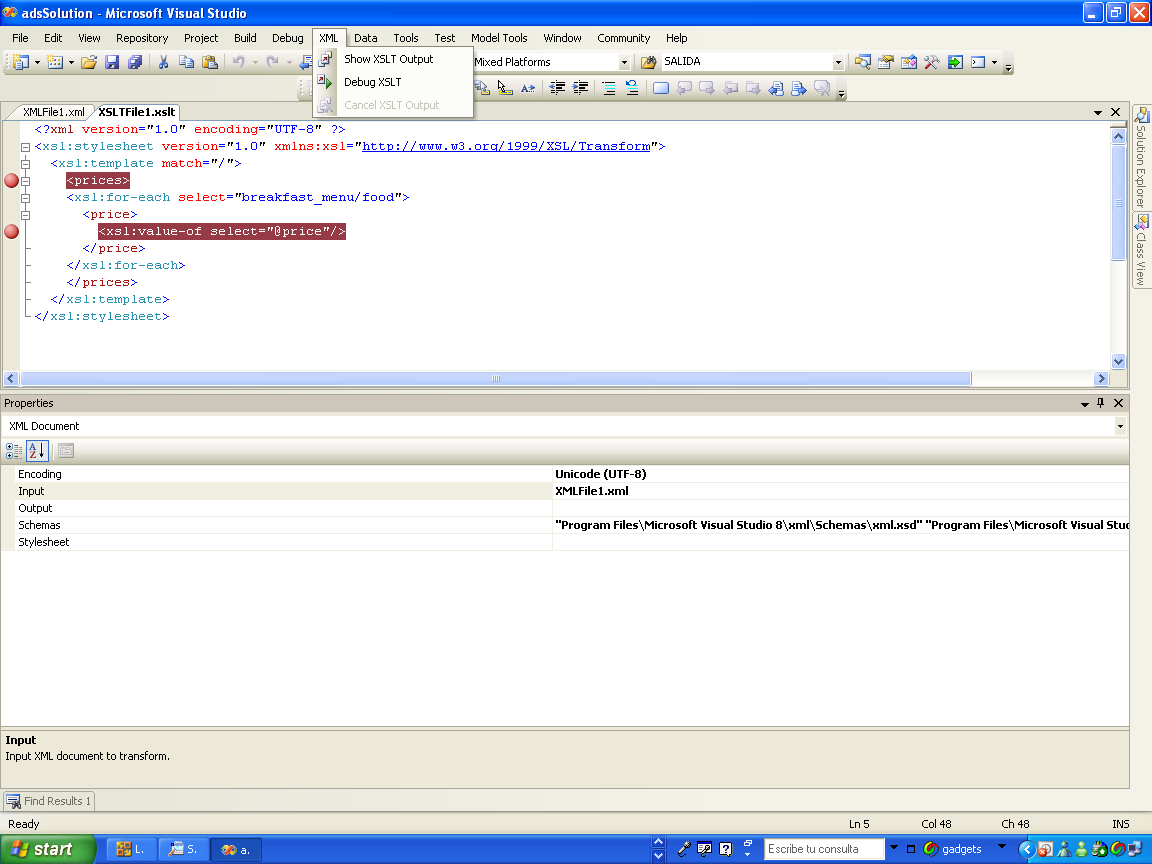
The Show XSLT output will run the complete XSL and let the XSL Output in a new
window. The output by default is not formatted. You can go to the
Edit\Advanded\FormatDocument option to format it.
The Debug XSLT option will start the debugger and stop in the breakpoints you
specified.
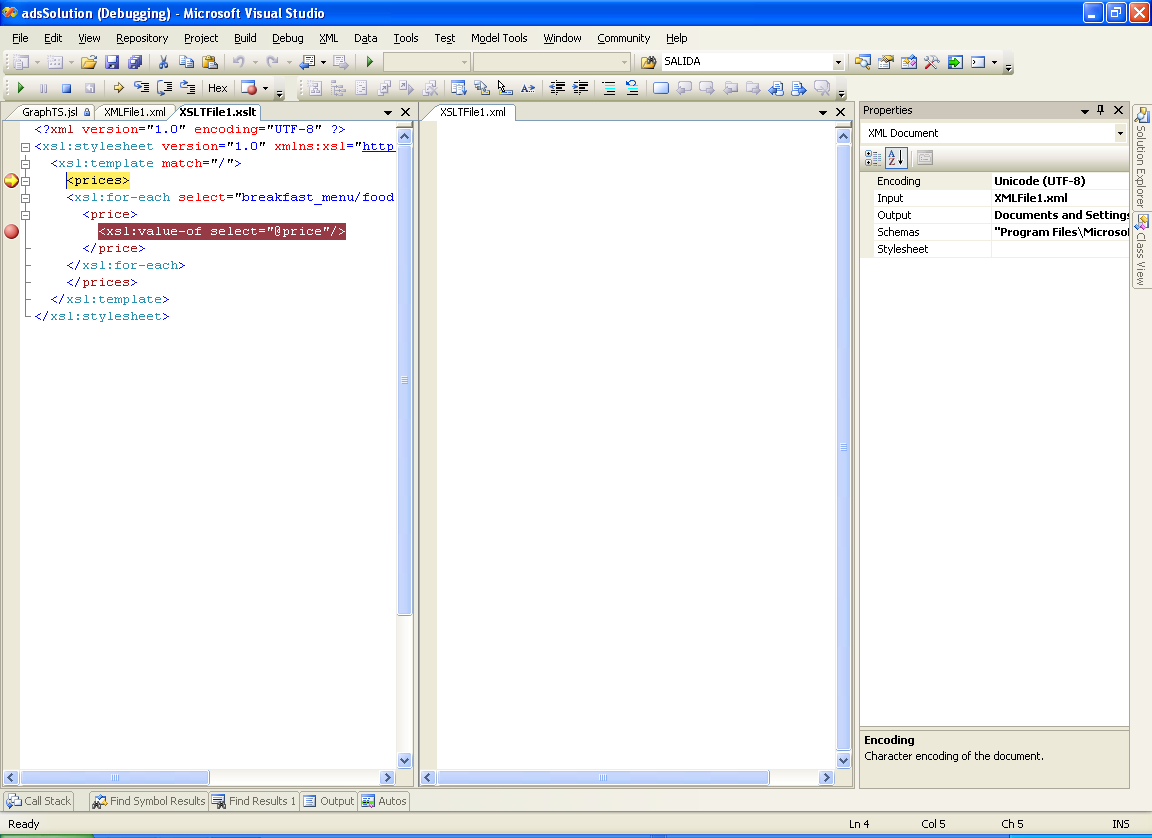
Press F10 or F11 to dig into the file. You can use the call stack windows and
even the vales for variables in the Quick Watch and Watch Windows.
You can write XPAth Expression in the Quick Watch Dialog.
There are three special values that are handy when debugging:
last() is the context size, position() is the position, or index
number, of the context node, relative to the context size; and
self::node() is the value of the context node.
And enjoy your debugging experience ;)