Finding DataReaders that are not being close in an .NET application can be something difficult.
Thats why I use this trick to detect which DataReaders where not close.
1. First add a new code file to your project.
2. Enter this code:
public static class SqlReaderTracer
	{
		static Dictionary<WeakReference,System.Diagnostics.StackTrace> traceInfo = new Dictionary<WeakReference,System.Diagnostics.StackTrace>();
		public static System.Data.SqlClient.SqlDataReader ExecuteReaderEx(this System.Data.SqlClient.SqlCommand command)
		{
			var stack = new System.Diagnostics.StackTrace(1, true);
			var reader = command.ExecuteReader();
			traceInfo.Add(new WeakReference(reader), stack);
			return reader;
		}
		public static void PrintTraceState()
		{
			Console.WriteLine("*******SQL Trace Results************");
			foreach (var reader in traceInfo.Keys)
			{
				if (reader.IsAlive)
				{
					var traceInfoFrame =  traceInfo[reader].GetFrame(0);
					var methodWhereItWasCreated =traceInfoFrame.GetMethod().DeclaringType.FullName + "." + traceInfoFrame.GetMethod();
					Console.Write("Reader alive created in " + methodWhereItWasCreated);
					if (traceInfoFrame.GetFileName() != null)
					{
						Console.Write(string.Format("at {0} ({1},{2})",traceInfoFrame.GetFileName(),traceInfoFrame.GetFileLineNumber(),traceInfoFrame.GetFileColumnNumber()));
					}
					Console.WriteLine();

				}
			}
		}

	}
And then to a Find /Replace All and change all the .ExecuteReader() for .ExecuteReaderEx(). 3. Ok Now. You are all set. To test it do something like this:
class Program
	{

		static void Main(string[] args)
		{
			var xxx = new System.Data.SqlClient.SqlConnection(@"Data Source=.\SQLEXPRESS;AttachDbFilename=D:\MyProjects\Phonebook.mdf;Integrated Security=True");
			xxx.Open();
			var ccc = xxx.CreateCommand();
			ccc.CommandText = "SELECT * from Phonebook";
			var reader = ccc.ExecuteReaderEx();
			xxx.Close();
			SqlReaderTracer.PrintTraceState();
			return;
		}
	}
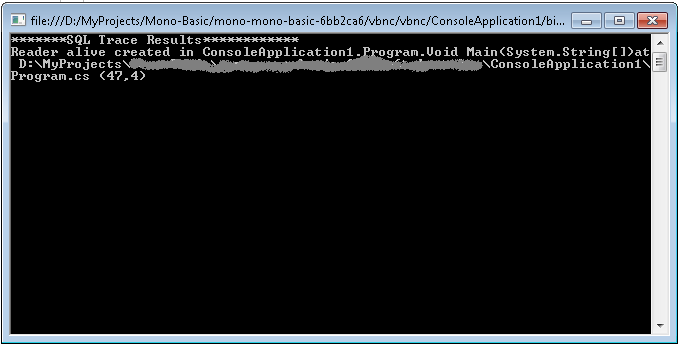
And you will see an output like:

I had a hard time trying to get some diagnostics from a RoleEntryPoint.
I was doing some setup in this entry point and getting some errors.
So I tought, mmmm: this is a Task for the super Azure DiagnosticMonitor.
And I added a bunch of Trace statements and waited to get some output in my WADLogsTables,
but NOTHING!!! ZERO NILCH! NADA!!
What happenned!!!
I took me a while to get to it. So
This is the things. I had to do.
1. First add a file called WaIISHost.exe.config
2. Add the Azure Diagnostics Trace Listener
<?xml version="1.0"?>
<configuration>

  <system.diagnostics>
    <trace>
      <listeners>
        <add name="AzureDiagnostics" type="Microsoft.WindowsAzure.Diagnostics.DiagnosticMonitorTraceListener, Microsoft.WindowsAzure.Diagnostics, Version=1.0.0.0, Culture=neutral, PublicKeyToken=31bf3856ad364e35">
          <filter type="" />
        </add>

      </listeners>
    </trace>
  </system.diagnostics>

</configuration>
3. And very very important, you must go to Copy to Output Directory property for this file and set it to Copy Always.

4. And another thing that you need is a lot of patience. The Diagnostics infraestructure takes a while.
So you add a Thread.Sleep after the Start call
DiagnosticMonitor.Start(storageAccount, configuration);
Thread.Sleep(10000);
5. After you do that you will be able to collect some information from the WADLogsTables